
Alisha McLean is a marketing analyst in New York City. She has a deep interest in strategy, analytics, and product innovation. Finance is her vertical. Learn more about her on LinkedIn.
Alisha McLean is a marketing analyst in New York City. She has a deep interest in strategy, analytics, and product innovation. Finance is her vertical. Learn more about her on LinkedIn.
Chasing Shapes Gaming App
For an interactive gaming experience, pull Chasing_Shapes from GitHub.

Alisha created an interactive game using HTML, CSS, and JavaScript titled Chasing Shapes. In this game, users race to click on the next appearing shape and try to beat their previous time. This app was made for fun and to test her understanding of what programmers do.
Tableau
For an interactive dashboard presentation, click here.
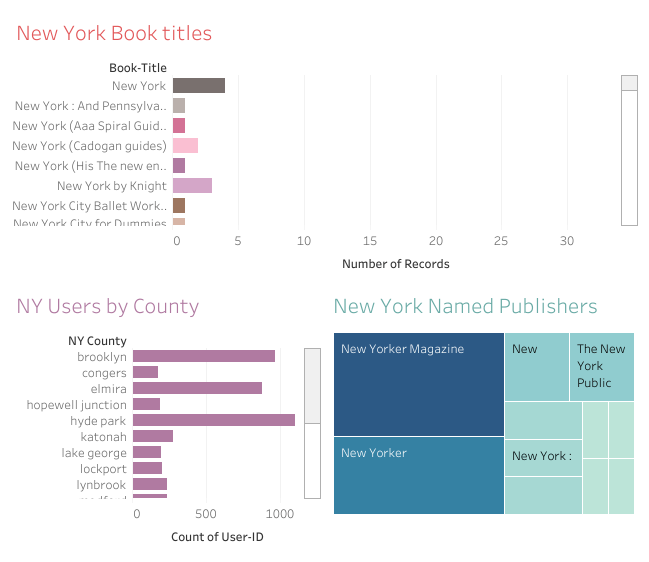
All About New York is a Tableau visualizations report Alisha created from the 2004 Book-Crossing community dataset. She did a subset of the data for New York and focused on authors, number of book titles, and publishers. The dashboard highlights the more important charts.
YouTube Trending Report
Click this GitHub link: YouTube Trending report
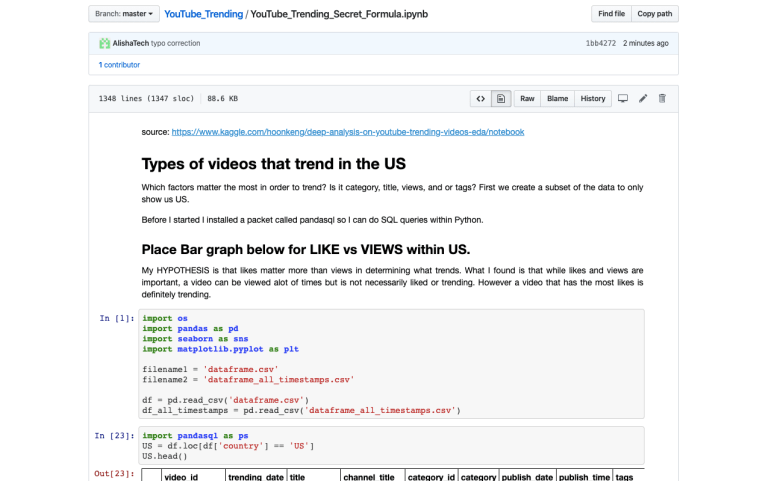
This YouTube Trending Secret Formula report shows the types of videos that trend in the US. Alisha dove into which factors matter the most in order to trend whether it’s category, views, title, likes, and or tags. She installed a pandasql package so she could do SQL queries within Python. There are queries, charts, and much more insights.
