
Tableau
For an interactive dashboard presentation, click here.
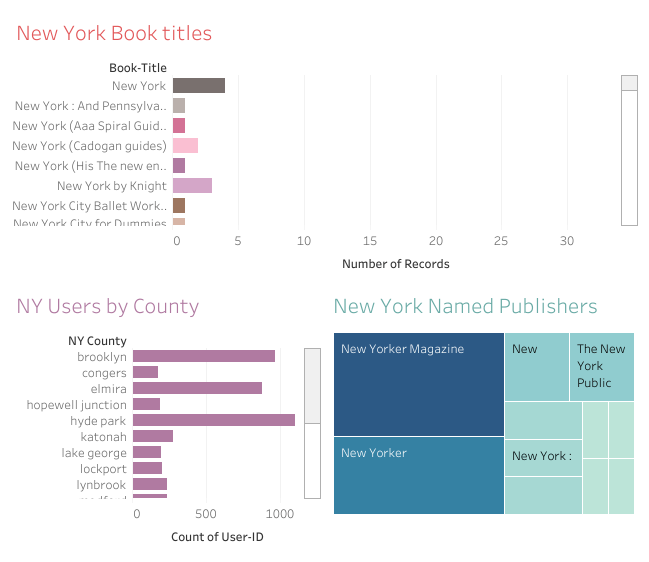
All About New York is a Tableau visualizations report Alisha created from the 2004 Book-Crossing community dataset. She did a subset of the data for New York and focused on authors, number of book titles, and publishers. The dashboard highlights the more important charts.
